So this whole idea started because I’ve had all my IoT-devices on a separate router for a while in order to keep it “to itself”. While doing some research for the lab config I was considering buying a new router that would allow me to play a bit with VLANs and separating the IoT device on a network where I could keep them isolated from each other.
I found out that my ASUS ZenWifi PRO ET12 had the option for VLANs added and as a little sugar on top they also added the ability to create IoT networks as guest networks.
A big warning - I’m not an IoT/OT/ICS expert or even someone who has a slight incling of what he’s doing. This is just the ravings of someone trying to learn, take it with a big pinch’o’salt.
Router Configuration
I did what any sane person would do and headed into my ASUS configuration and set up a new IOT network called Azkaban and started moving my IoT devices over there (cat feeders, robot vacuums, the works). First things first we have to create an IoT network by navigating to https://router_ip:8443/SDN.asp and selecting IoT network under “Smart Home Master” which is also my new title at home I guess:

From here we will be presented with the following creation wizard:

I chose to use a different subnet here than the main network rather than the default which is the same. After creating we have some more options in the General Settings:

The main thing to make sure here is that you are selecting a WiFi band and Auth method that fits with your IoT thingies. For me that was 2.4GHz and WPA/WPA2-Personal. The router has the option for a more dynamic WPA2/3-Personal config, but that throws some of my smart stuff of the network. After this we have the Advanced Settings:

Some notes here - you can see that the router supports VLANs which is huge. For me, I set up the DHCP server and the VLAN ID, but I don’t really use VLANs anywhere else (yet) so that’s not going to do much. I set up DNS to use Quad9’s 9.9.9.9 and 149.112.112.112. You will notice that it offers AP Isolation, meaning that each unit can only see the router and nothing else. Normally I would have this enabled, but that also kills Defender for IoTs visibility a bit so for now I have this turned off. And that’s it for the router setup. There is an extra option to set up a VPN server here:

Theoretically I guess we could also use this to proxy our traffic outbound to block some of it, but there is also an option to set up Firewall - Network Services Filter in the ASUS router, which allows to effectively block traffic from specific source IPs in our network. In a roundabout way, if we configured static IPs for all the IoT devices we could probably use this? Not really, the feature only works in either allow or deny mode, and in the deny mode you can effectively only block one port per Source IP per rule up to a max of 32 rules. The other way around, with allow-mode would be similarly bad because you’d only have 32 rules to open up traffic for all devices outbound on a total of 32 unique host/port combinations. The port field says “port range” but only takes a number as input. Room for improvement here.
The best option I could find would be to use the VPN Fusion function to tunnel all the traffic from the IoT network through an OpenVPN server and then have an outbound proxy on that OpenVPN server (like Squid, which we’ll get back to on a later post). Maybe we’ll visit that option at some point later.
Connecting my stuff

So what am I connecting to this network? Well, a bunch of stuff. First of all, I have two of these absolute nightmare pet feeders, complete with camera and microphone!
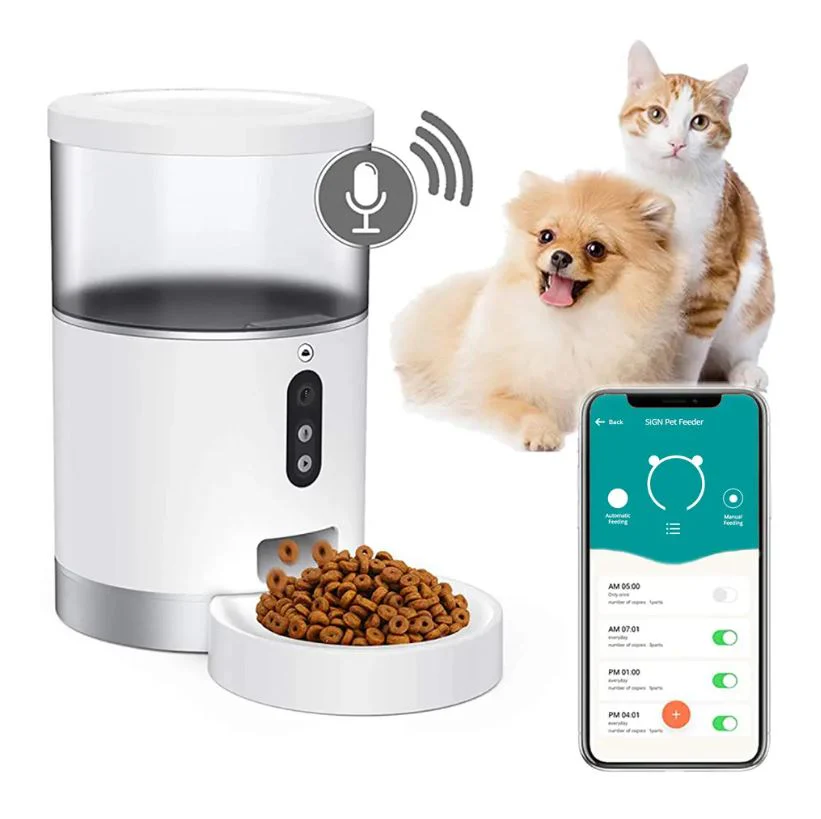
These are going straight into jail, along with my two robot vacuums. One is an older Roomba and then we have the Roborock S5. All of my Google Home stuff is also going in here. I tried putting my Sonos stuff into this network as well, but everything just kept dying and dropping connection so it’s now living in it’s own network free of worries.
Defender for IoT setup
For the Defender for IoT setup there’s a few steps involved:
- Setting up a Hyper-V vSwitch to connect to the Azkaban network
- Setting up a Hyper-V vSwitch for the management of the D4IOT tool
- Creating a Hyper-V VM and installing D4IOT
- Configuration of D4IOT
There’s been plenty of blogs written about how to set up your own Defender for IoT lab already, or just how to specifically set up the OT Sensor. Microsoft themselves have pretty solid guidance on the topic, so we’re not going to go into it in too much detail. I followed Microsoft’s guidance to the tee, and my configuration and “design” is shown below.
Configuration
I set up two network cards for the sensor VM:
- Hyper-V vSwitch - “Azkaban” - (IoT) network - 172.16.1.0/24
- This is a passthrough WiFi card.
- DHCP.
- Hyper-V vSwitch - “Core” - Management network - 192.168.0.0/24
- Internal network for connecting to D4IOT mgmt.
- Static IP 192.168.0.101
For the core network, we set it up in Powershell on the Hyper-V host:
$interface = Get-NetAdapter -name "vEthernet (Core)"
New-NetIPAddress -IPAddress 192.168.0.1 -PrefixLength 24 -InterfaceIndex $interface.ifIndex
Set-NetIPAddress -InterfaceIndex $interface.ifIndex -IPAddress 192.168.0.1 -PrefixLength 24
Set-DnsClientServerAddress -InterfaceIndex $interface.ifIndex -ServerAddresses 8.8.8.8
New-NetNat -Name Core -InternalIPInterfaceAddressPrefix 192.168.0.0/24
I also made sure to set the Azkaban network up with a “SPAN” port, turning on Port mirroring in the advanced settings of the Hyper-V vSwitch:

And that’s about it for the configuration I did.
Creating the VM
For the VM creation the only two specifics I did (outside of the vSwitches) was to make sure it was Generation 2 virtual machine:

And to set the memory to 8 GB with dynamic memory toggled off:

And now we can boot!
Installing Defender for IoT
Basically installing D4IOT is just adding a DVD-drive, making sure it’s first in the boot order and mounting the Defender for IoT ISO. That should send you to the correct boot menu. It has changed a few times over the years, but this is the current Hyper-V appliance boot menu:
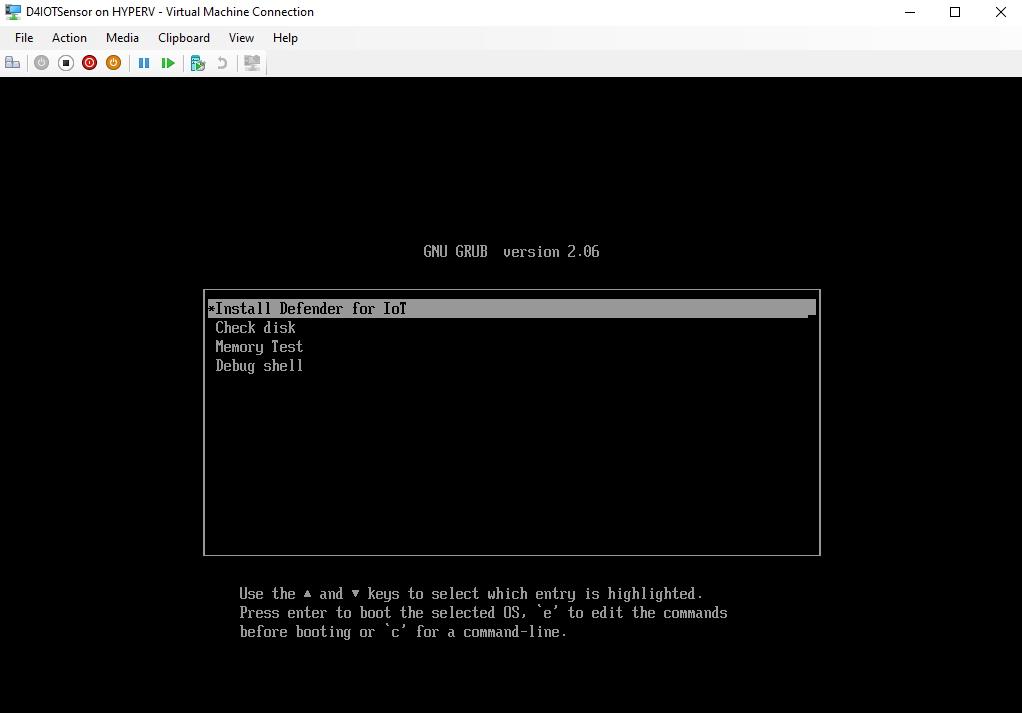
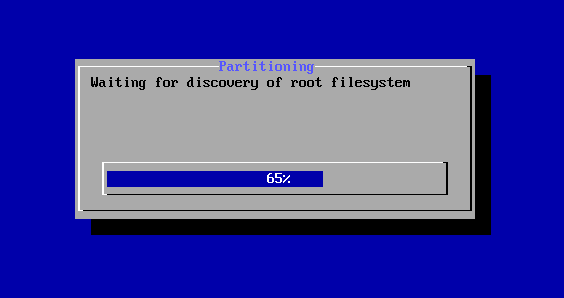
From here we start the installation:
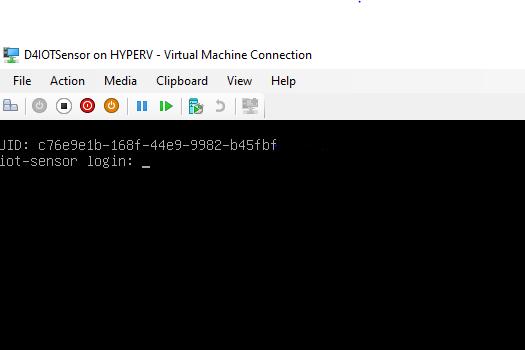
Aaaand after that we are prompted to login:
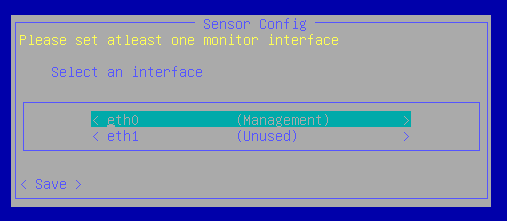
Then we can start configuring which is mainly about making sure the correct settings are set up on the right interfaces.
Once that is done, or simply once we have set up the management port to our “Core” network and made sure it has an IP we can head over to the user interface. Before that, though, we’ll do some stuff in the Azure Portal to prepare the activation of the sensor we just installed.
Configuring in the Azure Portal
In order to configure Defender for IoT we need to add a plan.

This plan will be connected to our subscription!

I’m going to go for the trial (and I need to remember to disable this at a later point I guess):

That was it for onboarding Defender for IoT. Next we need to set up a site. We can do this before or after we install the ISO, but in this case we are doing it after. Basically both the site and sensor configuration all happen in the same wizard:

Here we can create a sensor and site name. After creation we will also get a ZIP-file that contains the activation files for our sensor, so keep hold of that. The site view is located at https://portal.azure.com/#view/Microsoft_Azure_IoT_Defender/IoTDefenderDashboard/~/Sites
Mine looks like this (I created the test one for the blog):

Notice how the sensor health is red on the main sensor - that happens all the time and it’s just because there’s not a lot of traffic on the network. I was thinking it was going to be noisy as hell, but I was actually wrong in that assumption.
Configuration of Defender for IoT
Once you have the activation file, head over to https://defenderforiot_ip/settings and click Sensor management and Subscription and Activation mode. Just upload your file and your sensor should be activated.
If you didn’t configure your network cards you can do it in the menu. Currently my sensor is set up to be cloud management, so you can also click your sensor (once it’s activated) in the Azure Portal site menu and configure settings from there. The wizard leaves a lot to be desired though:

Clicking on any of the settings always opens up this view, no matter if there’s a setting or not:

Aaand if we want to add a setting, this is where we get taken to:

Yup. That’s how you view your settings, and adding them is also horrible.
Using Defender for IoT
The overview page looks like this (this has been populated with the devices that has been autodiscovered):

I’ve also added the subnet-range of 172.16.1.0/24 and the VLAN ID of 52 with a name IoT. That’s all the config I’ve done outside of defaults.
I did learn one thing - there’s a lot less traffic outbound from my IoT devices than I thought. Looking at the sensor most of the time it’s actually not detecting any traffic. There’s data on the network and it’s usually around the same time of day, that being 0100, 0900 and 1800. Strangely, there’s a lot of traffic on port 6667, which I usually see only when IRC is used.

But I don’t really have any ways of drilling down into the data here. I feel like I’m lacking some functionality.
What did I expect?
Well, I wanted to be able to see which devices were sending what data at what times. Like what ports it’s connecting to and when, what outbound IP’s it’s connecting to. Drilling down into data, or having the option to export the data into Sentinel or just send it to a syslog would be nice.
The dashboards didn’t really work because there wasn’t enough data, so you could argue that putting in more devices and in a real OT-env it would give more value - sure, but I’d still want my options to drill down more and see which devices are communicating to who (and where) and on what ports.
Testing with Kali
Inspired by the earlier link blogpost I also wanted to do a quick test with Kali Linux. I was going to install it to run some tests in my AD lab (which we will see in a later blog post).
Before we actually run some tests, we’ll integrated with Microsoft Sentinel.
Microsoft Sentinel integration
There’s a content hub package for Sentinel that contains the data connector, some analytic rules and more stuff. I’m going to install the solution, deploy the connector and some of the rules:

Out of the template analytic rules I enabled the following four:

The data connector is a simple switch, which is a nice change of pace from the other not-so-great UI we’ve had previously:

Now that’s connected, let’s run some tests!
Back to Kali Linux
What are we testing? Well, the only thing I can thing of that works quickly is to run NMAP. So that’s what we will do. In Kali the syntax for running the port scan I want is as follows:
nmap -sVC 172.16.1.0/24
5 hosts show up, that’s what we expect:

Now we’ll wait and see what results we get once the service scan completes.
Results
The results are in, basicall as we expected I guess not a lot of open ports on these IoT devices:

What’s interesting is that we are seeing port 6668 on the two pet feeders. This might give a little hint as to what’s going on with the massive amount of communication we are seeing on port 6667. It’s important to note that IoT-devices often communicate on non-standard ports. Just like you can send HTTP traffic on other ports than 80. So while I’m going to check this out in more depth later, it’s most likely just a quirk of this specific piece of equipment.
Was there any alerts in Defender for IoT or Sentinel? Not from the first scan as far as I could tell. I ran two new scans on all possible ports on the .24 and .33 devices, so one of the pet feeders and the Roborock S5 using the following command:
nmap -p 1-65535 172.16.0.X
This also yielded no results as of writing. Will update later if there are some delays in processing. My sensor is sized to be pretty small, so it might use some time to process all the data. Anyways, the only alerts I have are “No Traffic Detected” and then “Traffic Detected” a bit later.
Alert Reference
Checking the alert reference tells us that some alerts are disabled by default:
Several alerts are turned off by default, as indicated by asterisks (*) in the tables below. OT sensor Admin users can enable or disable alerts from the Support page on a specific OT network sensor.
Oh boy! Anyways, I’ve gone ahead and enabled all the tests.
Also, for specific alerts like “External address within the network communicated with Internet” we can edit the configuration. In this case the “report type” which can be either none, event or alert is set to none. I’ve changed it to alert just for fun.
The port scan is set up with “Example Ports count” to 10 and “Treshold” set to 25 - we should have blown waaaay past that.
Custom alert rules
We are also able to create custom alert rules, which is neat. Guidance here, but as Microsoft says:
You know your IoT devices best. For customers who fully understand their expected device behavior, Defender for IoT allows you to translate this understanding into a device behavior policy and alert on any deviation from expected, normal behavior.
I won’t get into too many details here, but we can set up an alert where we pick the alert protocol (like HTTP), the direction (from source to destination, or just from source) and the conditions such as TCP.flags, HTTP.method, IPv4.src.
Sample rule
I created a sample rule to hopefully alert me on outbound or inbound traffic to port 6667:
| Key | Value |
|---|---|
| Name | Communication to port 6667 |
| Alert Protocol | HTTP |
| Message | Just a test |
| Direction - SRC | 172.16.1.0 |
| Direction - DST | 172.16.1.0 |
| Condition - Variable | TCP.dstport == 6667 |
| Detected | Entire day, all week, all hours |
Looks something like this:

Do I know what I’m doing? Nope. Does Microsoft learn tell me much about how to do this. Nope again.
Conclusion
I’m going to have to set up some sort of packet capture on outbound traffic to see what devices are communicating where and what they’re saying. The port 6667-stuff warrants a deeper dive! For now, I’ve at least tried Defender for IoT for what it’s worth. The value is mostly in the detection for ICS, but for my use case of IoT and digging into my tiny environment there will be better tools for the job when it comes to deep dives.
The Lab
I’m running this on my fanless mini-PC which is again running Windows Server 2025 and Hyper-V. You can read more about the lab here: