Introduction
A quick word of warning - I’m writing this more as a personal note as I’m trying to learn more about cost estimation. Starting out very basic with some concepts and what factors might play into the amount of data you end up ingesting. This is useful for when we estimate based of earlier deployments of the same or similar data sources.
I’ll also try to touch on the topic of new data connectors, where we have no information from earlier deployments to lean to on and what do in that scenario. As always, questions and feedback are welcome.

(I’m sorry for the horrible meme)
Cost estimation concepts
Jumping straight into it, doing estimation on cost usually requires knowledge about two factors:
- The amount of data to be ingested per unit of time
- The cost of data ingestion, either per unit of time or size
Amount of data
The amount of data coming in is usually either given in Events per Second (EPS) or Gigabyte per day (GB/d). We will be using GB, so if you only know the EPS you can use the Sentinel EPS Log Size Calculator by Ashwin Venugopal to estimate your GB/day.
It’s important to know of factors that might affect the amount of data that comes in. Usually there are three big factors that play into this:
- Number of users/endpoints
- Policies
- Tresholds
Organizations of similar sizes (number of employees, servers) might have two different sets of policies (strict vs very lax) and two different philosophies in terms of log ingestion (high vs low treshold). These factors will impact the data ingestion in some way, depending on the log source. Sometimes it’s a small dent, sometimes it will make a big difference - so it’s important to keep in mind.
Cost of data
First and foremost, ingestion in Microsoft Sentinel is billed twice. This is by design, because Sentinel is a solution that goes on top of a Log Analytics workspace. This means we pay for ingestion into the underlying workspace and Sentinel.
For Microsoft Sentinel, data ingestion is billed based on a couple of different factors:
- Type of log
- Basic logs
- Comes at a lower price point for ingestion with limited retention and high search costs, usually reserved for verbose data sources like firewalls and networking equipment.
- Billed per GB.
- Analyic logs
- “Normal” logs with standard retention, searchable.
- Billed per GB or in commitment-tiers starting at 100 GB per day up to 5000 GB per day.
- Basic logs
- Azure Region
- Which region you have your workspace in will effect costs.
- Retention (not really part of ingestion cost, but will go into most price estimations).
- Free up to 90 days in Sentinel.
You also have things like data archival natively in Sentinel (or you could set up data export for cold storage into a storage account), search jobs and more that can incur costs, but we’ll avoid those for sake of brevity today.
Cost estimation methods
I’ve had the question “how much will this log source cost me” pop up a lot without any more information - the answer to that question will almost exclusively be “I don’t know” given the limited amount of information. One thing we will use for all our methods once we figure out the GB/day is the Pricing Calculator:
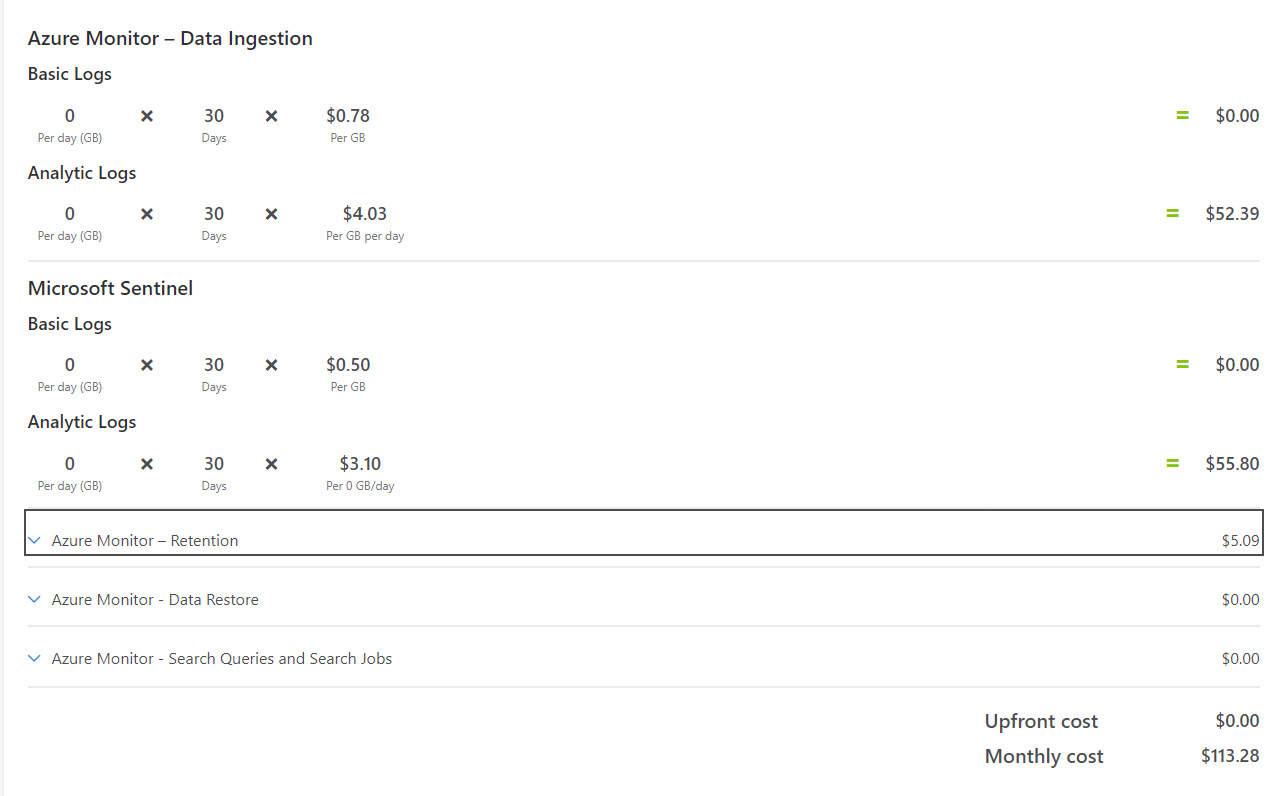
This allows us to take into account the amount of data we ingest, what type of logs we ingest it into, our retention and the region our workspace is based in. It will also show us if we could benefit from a commitment-tier or if we should stick to Pay-As-You-Go.
So what methods can we use, and more importantly what information do we need to use it?
1. We’ve set up the same data connector earlier
This is pretty easy, if we’ve set up the same data connector in another workspace earlier we can use that to estimate. If we assume it’s a different company we need to factor in a size difference (if there is one) and also some wiggle-room for the factors mentioned above when we talked about what factors might impact the amount of data ingested.
Let’s say the data connector we set up earlier generates 10 GB/day in logs for a company with a total of 100 users on the data source. If the new company has 40 active users and almost similar factors, we can do some simple math to figure it out.
We know that 100 people generate 10 GB/day, or 0.1 GB/day per person.
40 x 0.1 = 4 GB/day
There’s multiple ways to calculate it quicker, probably. We can also do the same math for endpoints, before plugging the GB/day into the pricing calculator.
2. We’ve set up a similar data connector earlier
Same as the first example, if we’ve set up log ingestion from a VPN-server earlier one might assume that the amount of data generated is similar if the tresholds for logging (usually CEF/Syslog) and the number of users are the same. Based on this we can estimate roughly a GB/day to use with the Microsoft Sentinel pricing calculator.
3. We know the EPS or GB/day
Some solutions might tell us what amount of EPS are generated (granted, if we send everything), or maybe we’ve been sending our logs to a syslog-server or another SIEM? In this case our estimation is pretty easy and can be done using the Microsoft Sentinel pricing calculator.
4. We have no clue?
So this is the point where a lot of the cost questions arise from - we don’t know. We haven’t set up a data connector of this type before, or anything remotely similar enough to estimate out of. We could ballpark it, but that’s usually not a good idea. There’s two routes we can possibly take in order to figure this out:
4.1 Ask someone else
You can try to ask a colleague, someone on a Sentinel-forum, Linkedin or other relevant forums if anyone has set up the log source before. If you’re able to get a rough overview over their policies, tresholds and amount of users/endpoints relevant to the solution you should be able to create a quick estimate of that.
4.2 Set up the data connector
This might seem like an obvious solution, but it’s by far the most accurate method. The process is pretty simple:
- Onboard the data source.
- Allow it to run for atleast 7 days (in order to capture an average over a weekend) and check for outliers using the query below:
Usage
| where StartTime >= startofday(ago(7d)) and EndTime < startofday(now())
| where IsBillable == true
| where DataType  == "YourDataType"
| summarize BillableDataGB = sum(Quantity) / 1000. by bin(StartTime, 1d), DataType
| render timechart
- Run a Kusto query to see how much data the solution generated over 7 days (or 30, if you let it run for that long):
Usage
| where StartTime >= startofday(ago(7d)) and EndTime < startofday(now())
| where IsBillable == true
| where DataType  == "YourDataType"
| summarize BillableDataGB = sum(Quantity) / 1000. by DataType
- Multiple that number by 4.3 (assuming every month is a bit more than 30 days).
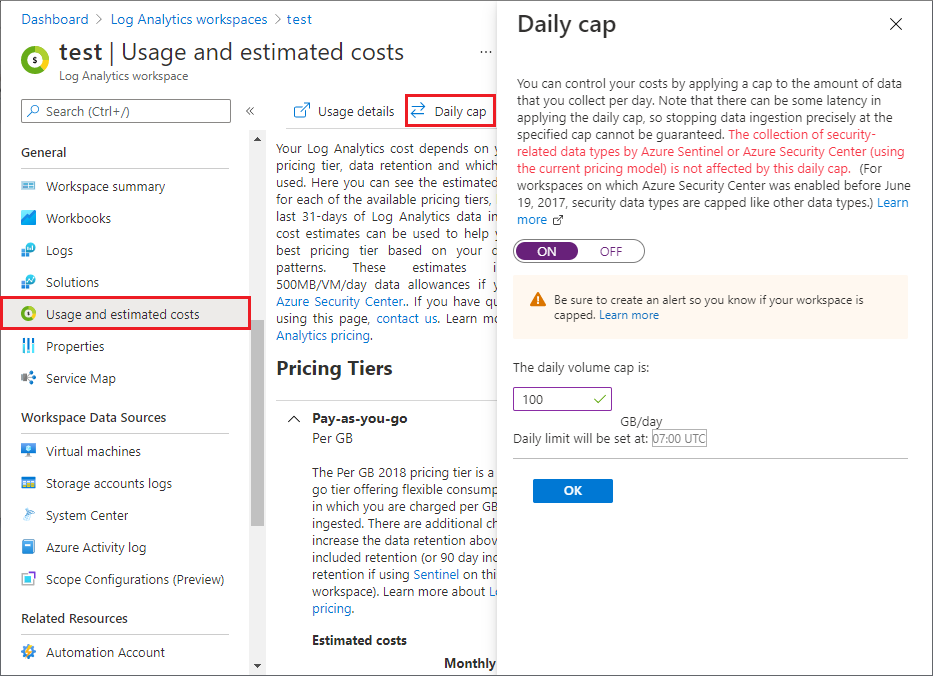
If you’re unsure about doing it this way in fear of generating too much cost, you can implement a cost cap. Just see what your average ingestion is pre onboarding the data connection and set the cap to double that - this should prevent your from blowing your entire SIEM-budget overnight:
If you want some more ideas for queries to run, check out “Run queries to understand your data ingestion” courtesy of Microsoft Learn.
Closing words
Estimation is usually not tricky because it’s hard to do, it’s tricky because the number you end up producing will usually end up as a point of contention in some way. It’s easy to overestimate in fear of estimating to low and being arrested on it later, but we should aim to be as accurate as possible.
It’s also important to be up front with anyone that has an interest in the estimation about the accuracy of the process. Sometimes it’s close to impossible to produce an accurate estimate with the information available.
Resources
- Microsoft Sentinel Cost Workbook - blog post by Rod Trent
- Hunting down costs within Log Analytics - article by Nathan Swift
- Manage and monitor costs for Microsoft Sentinel - Microsoft Learn
- Data and cost estimation for Log Analytics - blog post by Christoph Petersen
- Azure Monitor Logs cost calculations and options - Microsoft Learn
- Reduce costs for Microsoft Sentinel - Microsoft Learn
- Optimize your Microsoft Sentinel pricing - by Koos Goossens